


 40 / 50

40
RAPPORT D’ACTIVITÉ 2018
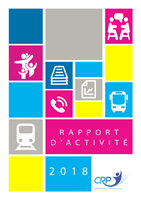
RÉPARTITION DES
PENSIONS DIRECTES
DU RÉGIME SPÉCIAL
PAR ÂGE MOYEN ET NOMBRE MOYEN DE TRIMESTRES
PAR CSP ET FAMILLE DE MÉTIERS
(FLUX)
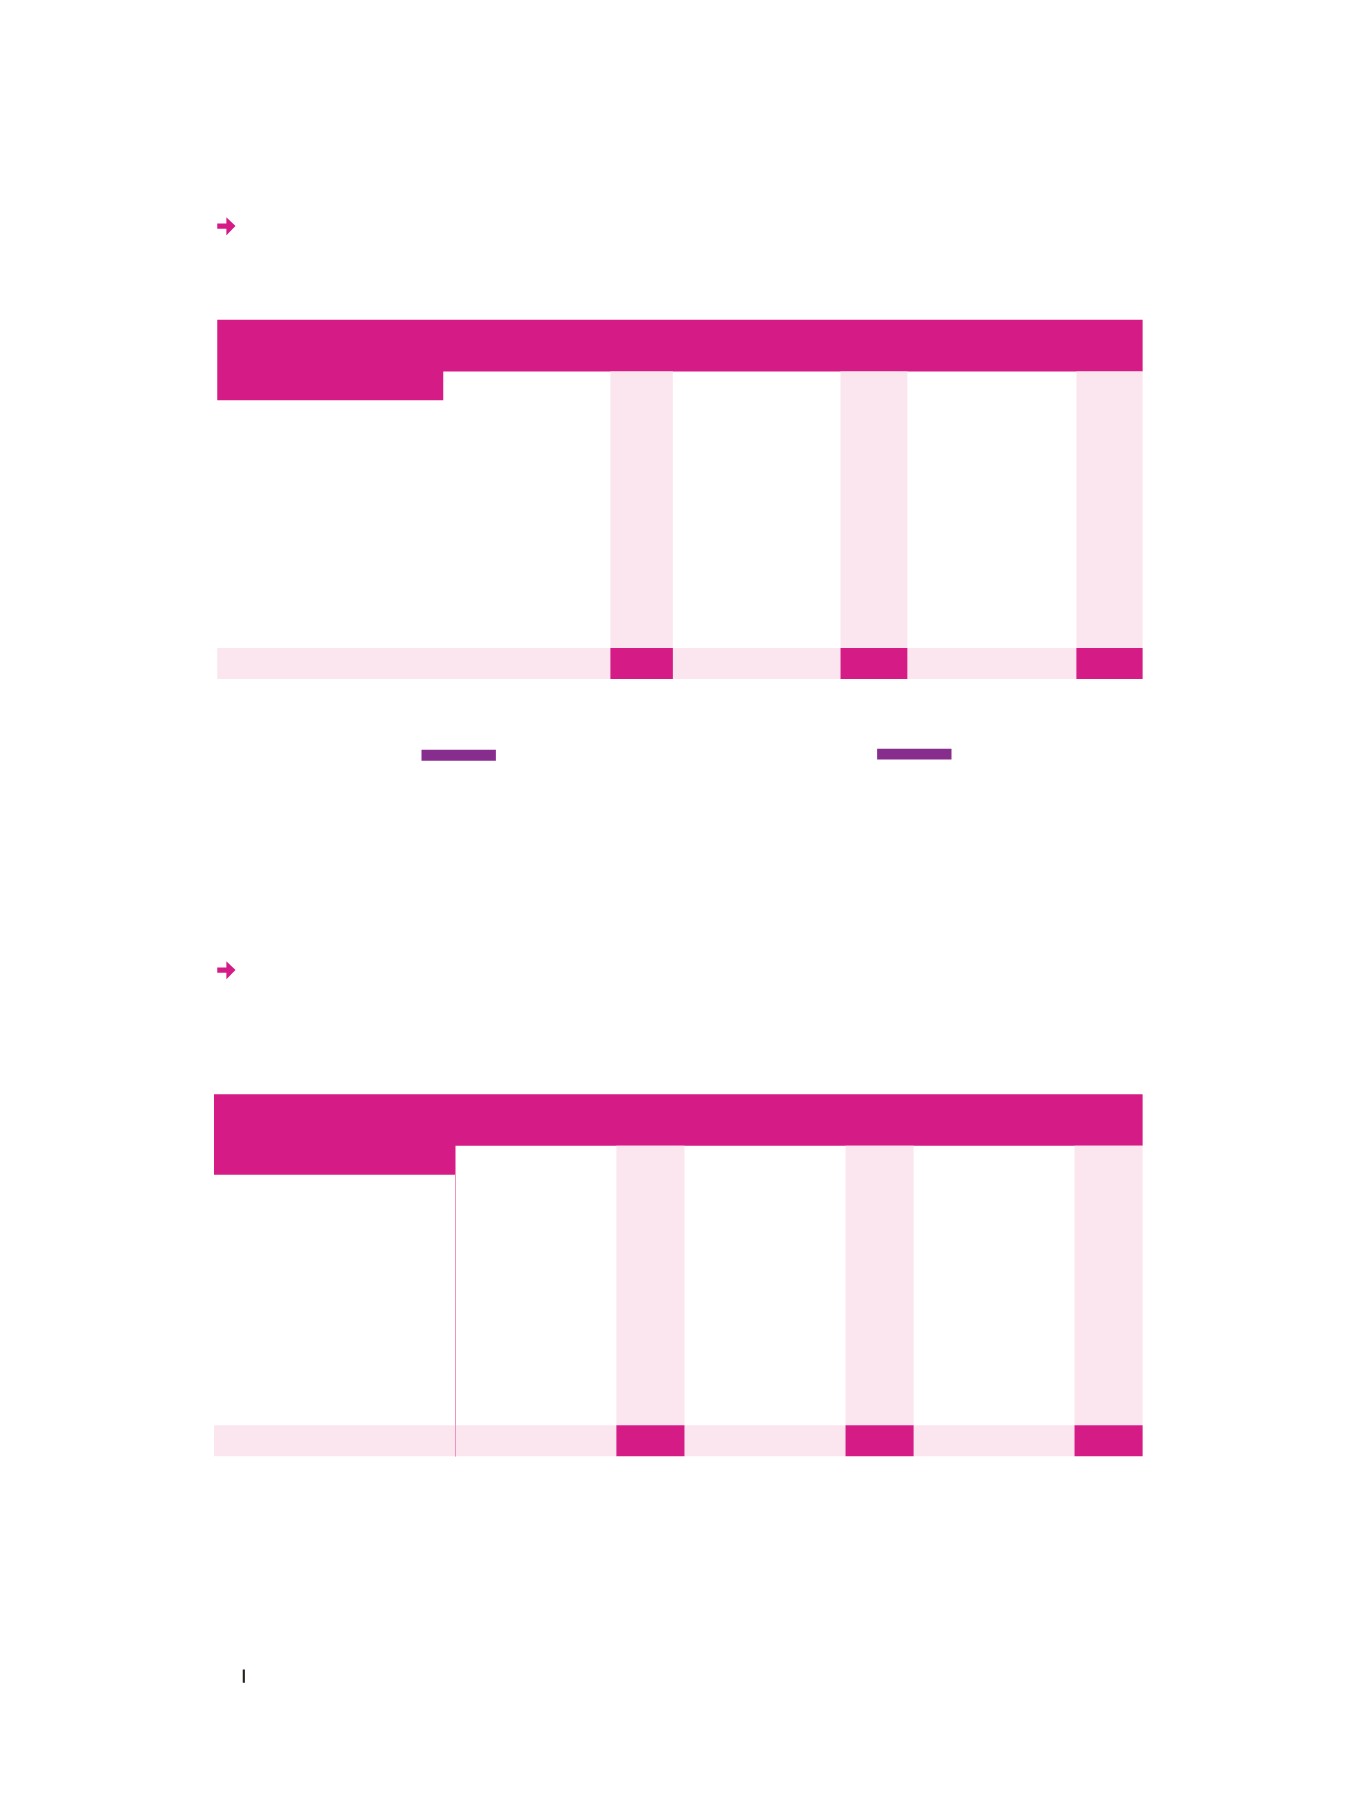
RÉPARTITION DES
PENSIONS DIRECTES
DU RÉGIME SPÉCIAL
PAR ÂGE MOYEN ET NOMBRE MOYEN DE TRIMESTRES
PAR CSP
ET FAMILLE DE MÉTIERS
(STOCK)
Catégorie
socio-professionnel
et famille de métiers
Flux pensions directes
RATP 31/12/2018
Âge moyen
Nombre de Trimestres
Hommes Femmes
Total
Hommes Femmes
Total
Hommes Femmes
Total
Cadres
92
22
114
59,43
59,65
59,47
153,11
139,41
149,59
Maîtrises
249
55
304
56,01
55,53
55,92
148,93 143,44
147,11
Opérateurs
514
102
616
55,53
53,29
55,16
138,85 130,35
136,86
- conducteurs
86
24
110
55,68
54,36
55,39
147,73 141,58
145,74
- machinistes
199
15
214
55,26
50,00
54,89
131,74 112,13
129,64
- maintenance
102
1
103
55,96
54,34
55,95
145,26 160,00
144,48
- exploitation
119
55
174
55,41
53,41
54,78
138,27 131,04
135,84
- administratifs
8
7
15
56,56
55,57
56,10
147,25 121,29
134,13
ENSEMBLE
855
179
1 034
56,09
54,76
55,86
143,32 135,49
141,27
Catégorie
socio-professionnel
et famille de métiers
Effectif pensions
directes RATP 31/12/2018
Âge moyen
Nombre de Trimestres
Hommes Femmes
TOTAL
Hommes Femmes
TOTAL
Hommes Femmes
TOTAL
Cadres
3 475
872
4 347
72,62 71,72
72,44
145,22 140,41
144,25
Maîtrises
8 312 1 674
9 986
69,15 67,59
68,89
142,67 131,60
140,81
Opérateurs
16 404 4 244
20 648
67,80 69,44
68,14
132,2 119,56
129,61
- conducteurs
3 322
261
3 583
69,19 57,37
68,33
138,63 127,64
137,83
- machinistes
6 837
658
7 495
67,21
70,02
67,46
127,12 109,94
125,62
- maintenance
3 657
67
3 724
69,26 68,22
69,24
137,86 109,33
137,35
- exploitation
2 280 2 997
5 277
65,57 70,53
68,39
129,38 121,26
124,77
- administratifs
308
261
569
65,25 67,74
66,39
129,39 118,82
124,54
ENSEMBLE
28 191
6 790
34 981
68,79 69,27
68,88
136,89 125,21
134,63
55,46 ans
âge moyen des pensions entrants en 2017
55,86 ans
âge moyen des pensions entrants en 2018