


 38-39 / 75

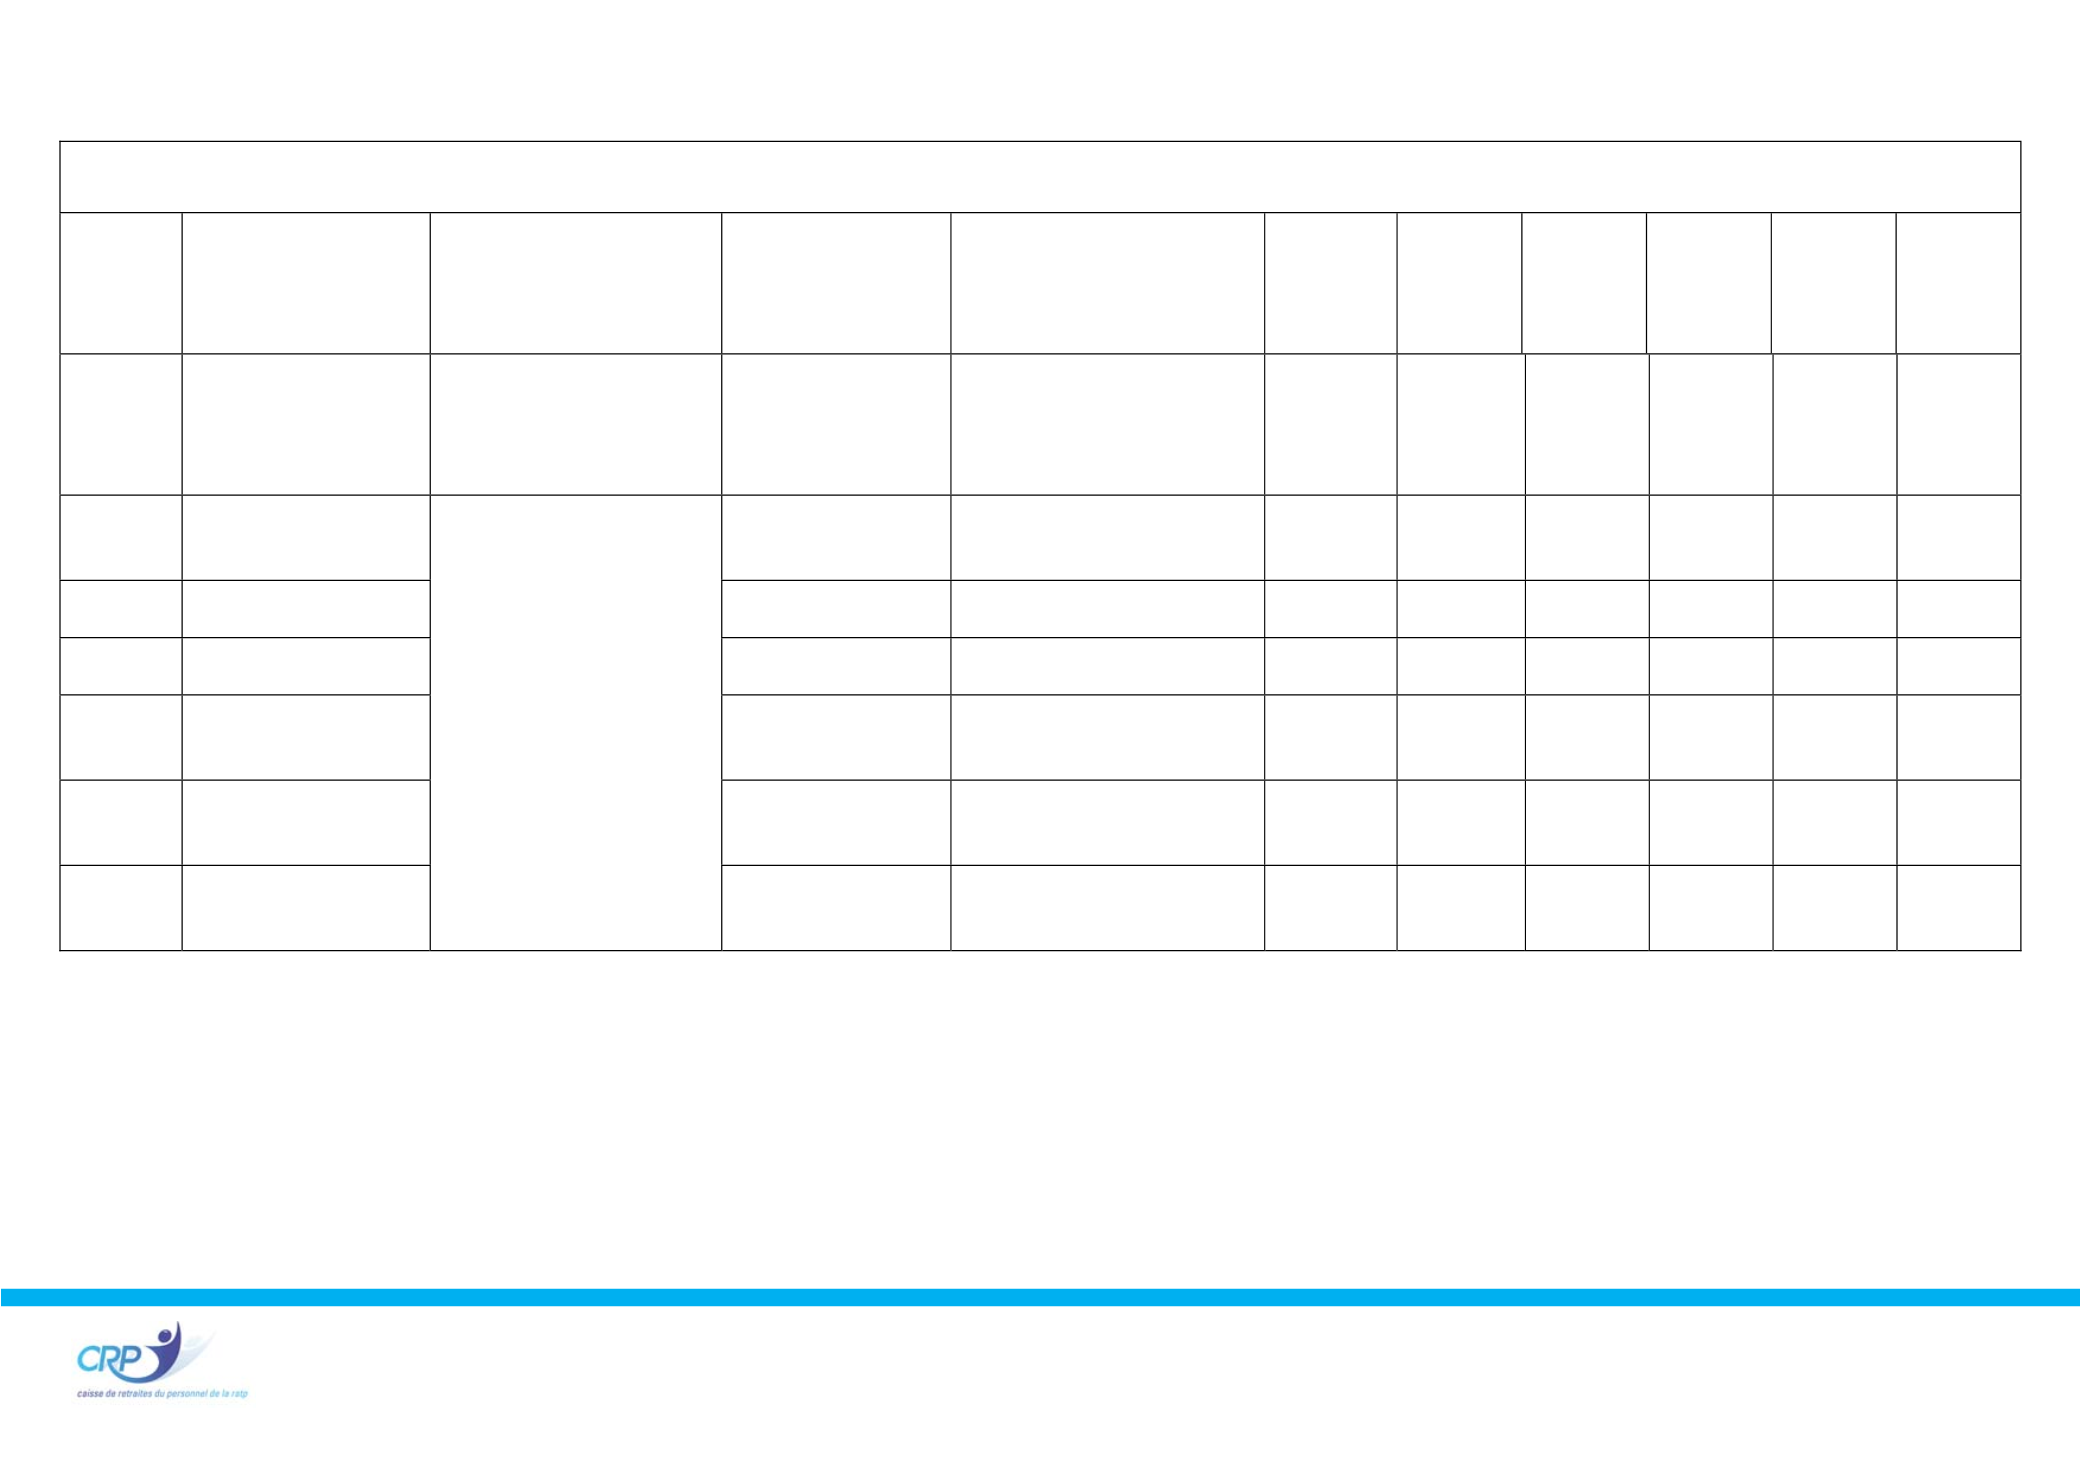
36
Convention d’objectifs et de gestion
2022‐2026
CONFORTER NOTRE LEGITIMITE PAR UNE IDENTITE DE PERFORMANCE
COG
2.2.1
Taux de mutualisation
des achats en intra et
en interbranche
DEVELOPPER LES
PARTENARIATS ET LES
MUTUALISATIONS A
VALEUR AJOUTEE POUR
LA CAISSE
Indicateur de suivi
FT900
Néant
12%
14%
16%
18%
20%
COG
2.3.1
Montant des fraudes
évitées
PROFESSIONNALISER LA
LUTTE CONTRE LA
FRAUDE EN OPTIMISANT
LA GESTION DES
DONNEES
Indicateur
opposable
2 022 760 € 2 050 000 € 2 100 000€ 2 150 000€ 2 200 000€ 2 250 000€
COG
2.4.1
Nombre d’usagers /
nombre d'ETPMA
(CDI+CDD)
CONFORTER UN
PILOTAGE PAR
L’EFFICIENCE ET LA
VALEUR AJOUTEE
Indicateur
opposable
2 353,41
> 2100
> 2150
> 2200
> 2250
> 2300
COG
2.4.2
Taux de performance
budgétaire
Indicateur de suivi
49,55 %
< 52 %
< 51 %
< 50 %
< 49 %
< 48 %
COG
2.4.3
Ratio de surface
utile/Agent
Indicateur de suivi
FT700
17,88 m²
≤ 19 m²
≤ 18 m²
≤ 18 m²
≤ 18 m²
≤ 16 m²
COG
2.4.4
Taux d’évolution de la
consommation
d'énergie
Indicateur de suivi
D105
101,53
KwH/m²
- 1 % /
2019
- 2 % /
2019
- 3 % /
2019
-4 % /
2019
- 6 % /
2019
COG
2.4.5
Taux d’incidences
financières des
erreurs (TIF)
Indicateur
opposable
MRF130
Néant
< 1%
< 0,95% < 0,90% < 0,85% < 0,75%
COG
2.4.6
Taux de
recouvrement des
indus à 24 mois
Indicateur
opposable
MRF510
Néant
> 80%
> 82%
> 85%
> 88%
> 90%
ANNEXE 1